The levelling up outlook #4
CPP's regular levelling up outlook which this month focuses on the adult social care reforms
30 September 2021
5 minute read
This is CPP's fourth levelling up outlook tracking the country’s progress in reducing economic inequalities in the context of the ongoing crisis. We are using the latest official statistics and other reliable data to publish the outlook every quarter.
Ahead of the government’s Spending Review, CPP’s latest Levelling up outlook explores how social care is failing ‘left behind’ communities and how the recent social care reforms will do nothing to address this.
Has the pandemic redrawn the map of deprivation?
Covid mortality and population density are more important than pre-existing deprivation in determining the worst-hit local labour markets during the crisis:
- The 14-month covid mortality rate and population density explain over 60% of the changes in the claimant count by local authority seen since the start of the crisis.
Low earners have consistently borne the brunt of economic shutdowns over the course of the pandemic:
- Average wages for those on furlough would have been £484 per week if they had been working, by comparison to £573 for the whole of the UK.
Implications for levelling up: if someone was a low earner living in a highly populated urban area which had high levels of exposure to the virus, they are likely to have been particularly badly impacted during this pandemic. Addressing inequalities within places (as distinct from between places) has become more urgent.
Despite these labour market impacts, the map of deprivation is largely the same as it was before the pandemic.
- The statistical relationship between 2019 deprivation scores for local authorities and the unemployment claimant count has only moderately weakened – from 83% in February 2020 to 73% by July 2021.
Over the longer term, the recovery is likely to be bumpy with different places likely to experience very different paths.
- Analysis of three historic economic crises shows there is a far from perfect statistical relationship between those local areas that were worst hit in the first year of a crisis and their recovery paths four years down the line (measured in terms of gross value added relative to pre-crisis trend). A correlation of 1 means a perfect positive relationship, yet for the 2008 crisis it was just 0.4.
Implications for levelling up: while this is not a repeat of 2008, the pandemic has yet to run its course and so too have the potentially negative economic consequences for the UK’s most vulnerable people and places.
Spotlight on adult social care
CPP analysis shows social care is currently not working for the least well-off people and places, undermining the levelling up agenda:
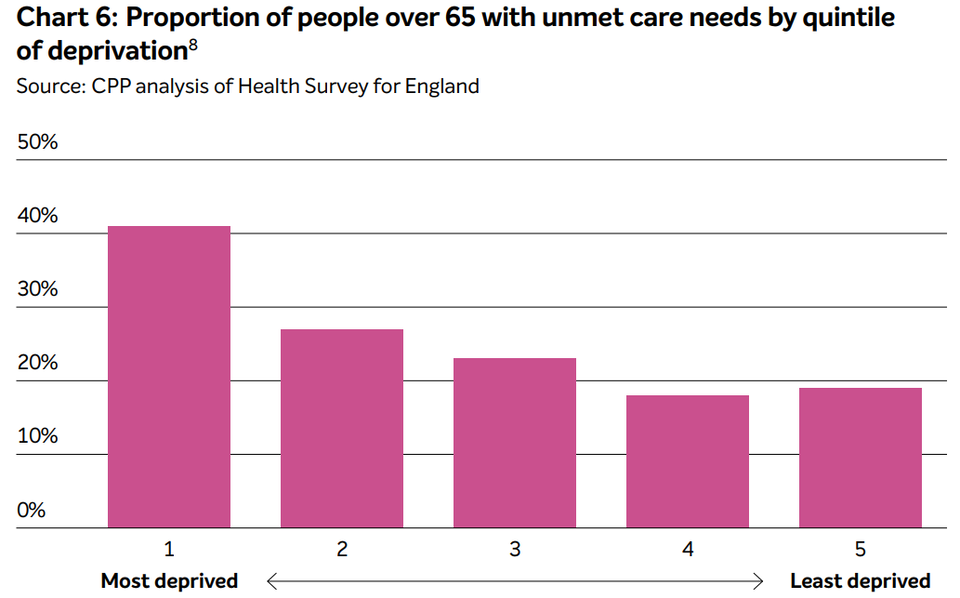
Unmet needs
In the most deprived places, over 40% of older adults who need help to perform key activities of daily living such as using the toilet or getting dressed, received no support. This compares to 19% of older adults needing help in the least deprived places.
Increased unplanned hospitalisations
A&E visits for chronic conditions like diabetes and asthma are higher in the most deprived parts of England than the least. But these visits would be preventable with better care in the community, including adult social care.

Reduced employment and earnings
Among those who had provided care in the last month, 23% of women doing over 10 hours per week left employment altogether, while 14% reduced their hours. Overall, half of women had their employment affected. The personal financial costs of unpaid care fall hardest on the poorest women – 23% of women in low-income households faced financial difficulties from providing unpaid care in the last month, compared to 10% in higher income households.

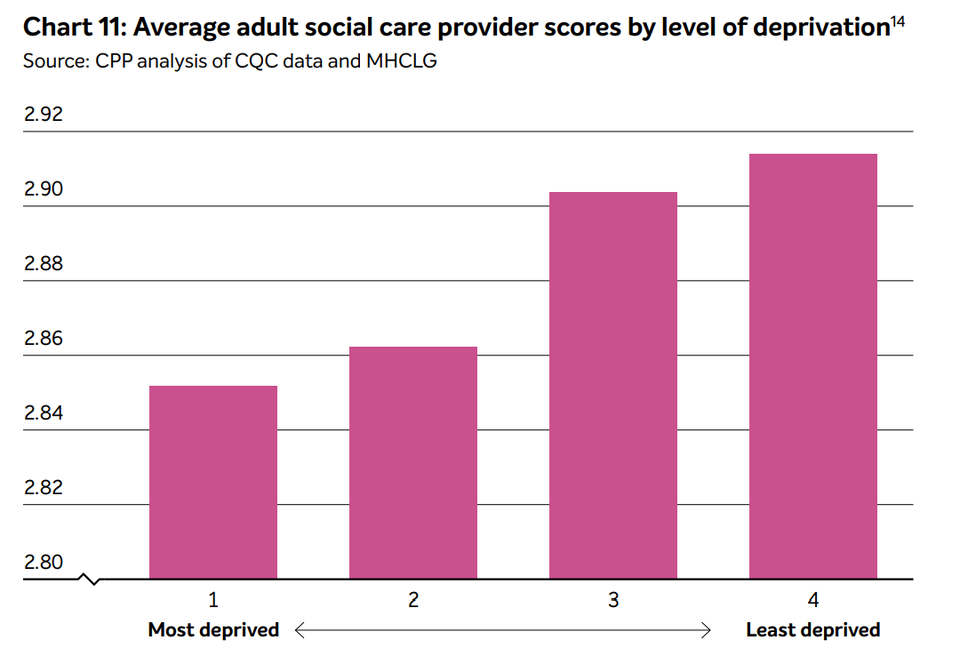
The quality of social care
Based on new CPP analysis of Care Quality Commission data, social care provision is of lower quality in the most deprived areas than in the least deprived areas.
Do the social care reforms rise to the challenge?
CPP’s analysis of the government’s reforms demonstrates how the focus is on saving personal assets of those needing to pay for care, rather than on the quality and accessibility of care:
- Of the new £5.4bn raised for adult social care, only £500m is allocated to professionalising the workforce, recruitment and retention. This is equivalent to just 11,000 extra care workers a year, yet 149,000 left the sector in 2019/20.
- The resources for social care are also likely to be reduced by the new national insurance levy for health and social care – costing social care employers over £100m per annum.
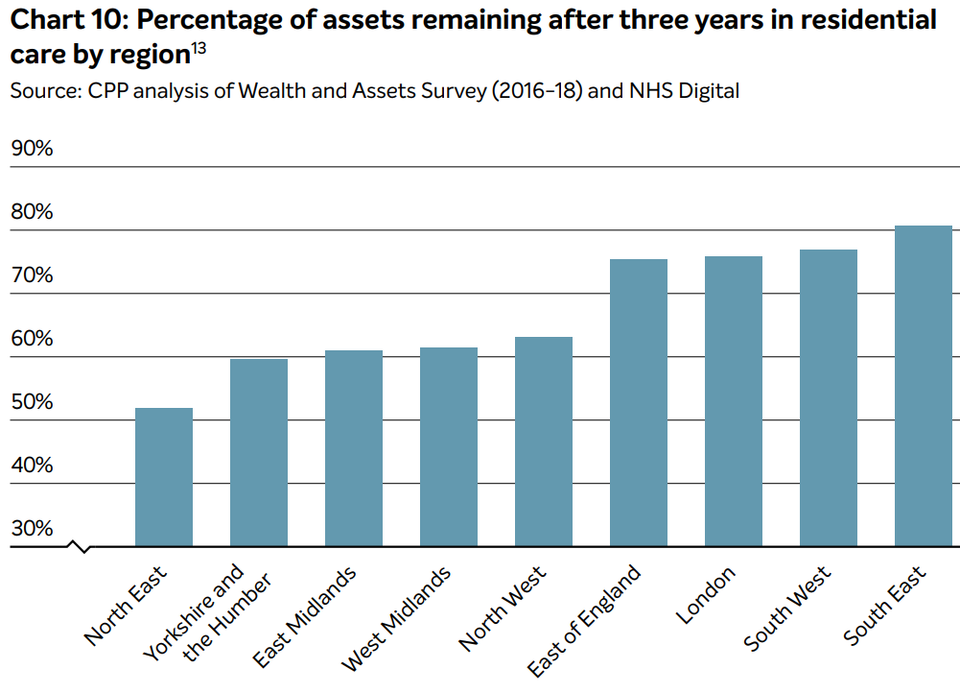
- The key announcement focused on the new cost cap and means test. CPP analysis shows that households in the North East spending three years in residential care would risk losing around 50% of their wealth and assets whereas people in the South East would lose about 20%. Even after reaching the cost cap, people will still be liable for day-to-day living costs while in care, so costs are still likely to be prohibitive for many.
With the Levelling Up White Paper and Spending Review around the corner, the government must ensure it is clear how all policies will contribute to its ‘flagship’ policy agenda rather than undermining it.