COVID-19 local area health risk rating: 22 April 2020
Key findings using the latest data include:
- In the last update Middlesbrough took over top spot as the riskiest local authority. It retains its position with a high overall case load relative to the size of its population and a high degree of underlying health system vulnerability.
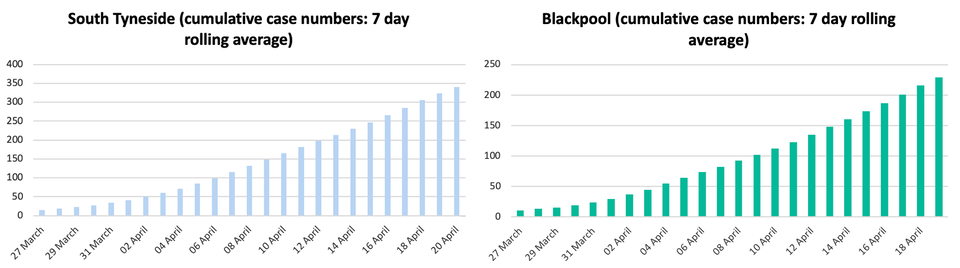
- The biggest movers in the index are in the North East – Gateshead, (now ranked 5th, has overtaken 14 local areas), Sunderland (now ranked 10th, has overtaken 15 local areas), and South Tyneside (now ranked 12th, has overtaken 37 local areas). All saw significant increases in case load over the last 10 days and have high underlying health vulnerability.
- Blackpool was also a big mover this week (now ranked 13th, has overtaken 8 local areas). It has several markers of systemic vulnerability including very low healthy life expectancy, high mortality rates from treatable conditions and a high proportion of older people. Blackpool’s Covid-19 case load has been increasing consistently over the last month.
Commentary on the results
In the context of daily case numbers plateauing at the national level, there has been increased interest in ending the lockdown soon. Our risk ranking suggests that some of the most systemically vulnerable communities are still seeing rising case numbers so relaxing nationwide public health restrictions in the near term would likely harm the health of these communities the most (see charts below).
50 highest risk authorities (1 = most risky)
Please click here for more details about the health index including data and methods
| Local authority | COVID-19 cases per 100,000 | Healthy life expectancy | CQC score | Treatable mortality | % aged 65+ | Overall risk score | Overall rank | Weekly change | CCG |
| Middlesbrough | 289.59 | 57.80 | 2.75 | 133.90 | 16.20 | 186.10 | 1 | 0 | NHS South Tees CCG |
| Walsall | 251.96 | 56.40 | 2.76 | 106.20 | 17.60 | 200.98 | 2 | 0 | NHS Walsall CCG |
| Wirral | 251.52 | 61.40 | 2.71 | 97.40 | 21.60 | 225.22 | 3 | +1 | NHS Wirral CCG |
| Wolverhampton | 228.62 | 58.70 | 2.77 | 118.90 | 16.60 | 243.34 | 4 | -1 | NHS Wolverhampton CCG |
| Gateshead | 299.74 | 60.80 | 2.84 | 99.60 | 19.40 | 272.82 | 5 | +14 | NHS Newcastle Gateshead CCG |
| St. Helens | 273.26 | 59.20 | 2.89 | 101.40 | 20.40 | 274.44 | 6 | -1 | NHS St Helens CCG |
| Sandwell | 237.03 | 57.10 | 2.83 | 117.60 | 15.00 | 275.66 | 7 | -1 | NHS Sandwell and West Birmingham CCG |
| Knowsley | 284.15 | 58.30 | 2.87 | 113.00 | 17.10 | 278.32 | 8 | -1 | NHS Knowsley CCG |
| Barnsley | 194.13 | 58.80 | 2.66 | 92.40 | 19.30 | 292.80 | 9 | -1 | NHS Barnsley CCG |
| Sunderland | 332.35 | 57.90 | 2.92 | 94.70 | 19.40 | 295.32 | 10 | +15 | NHS Sunderland CCG |
| Halton | 207.89 | 59.50 | 2.76 | 100.90 | 18.10 | 296.16 | 11 | -2 | NHS Halton CCG |
| South Tyneside | 246.90 | 58.90 | 2.87 | 93.30 | 20.00 | 319.10 | 12 | +37 | NHS South Tyneside CCG |
| Blackpool | 193.10 | 53.30 | 3.04 | 134.80 | 20.40 | 329.58 | 13 | +8 | NHS Blackpool CCG |
| Redcar and Cleveland | 163.11 | 60.60 | 2.83 | 102.60 | 22.30 | 336.86 | 14 | -4 | NHS South Tees CCG |
| Rotherham | 194.58 | 59.50 | 2.85 | 100.60 | 19.50 | 336.96 | 15 | -4 | NHS Rotherham CCG |
| Luton | 226.52 | 59.30 | 2.79 | 109.70 | 12.40 | 342.48 | 16 | +2 | NHS Luton CCG |
| Oldham | 205.84 | 58.00 | 2.87 | 111.90 | 16.10 | 353.58 | 17 | 0 | NHS Oldham CCG |
| Dudley | 189.32 | 59.40 | 2.81 | 89.60 | 20.30 | 359.24 | 18 | -3 | NHS Dudley CCG |
| Slough | 212.59 | 58.70 | 2.75 | 101.70 | 10.00 | 363.88 | 19 | +3 | NHS East Berkshire CCG |
| Tameside | 170.07 | 60.40 | 2.78 | 103.90 | 17.60 | 364.06 | 20 | -7 | NHS Tameside and Glossop CCG |
| Liverpool | 236.86 | 60.70 | 2.85 | 117.70 | 14.70 | 368.50 | 21 | -5 | NHS Liverpool CCG |
| Birmingham | 206.86 | 59.20 | 2.82 | 109.40 | 13.00 | 372.00 | 22 | -8 | NHS Birmingham and Solihull CCG |
| Sheffield | 289.10 | 61.80 | 2.80 | 89.50 | 16.10 | 381.44 | 23 | +1 | NHS Sheffield CCG |
| Wakefield | 119.70 | 58.60 | 2.76 | 94.70 | 18.90 | 385.18 | 24 | -4 | NHS Wakefield CCG |
| Hackney and City of London | 203.10 | 58.60 | 2.74 | 97.80 | 7.50 | 393.36 | 25 | -13 | NHS City and Hackney CCG |
| Manchester | 159.23 | 57.90 | 2.78 | 136.10 | 9.30 | 403.08 | 26 | -3 | NHS Manchester CCG |
| Northumberland | 193.90 | 61.20 | 2.86 | 80.40 | 24.30 | 417.04 | 27 | +15 | NHS Northumberland CCG |
| Lancashire | 179.33 | 60.40 | 2.88 | 93.26 | 20.50 | 420.92 | 28 | -2 | NHS Chorley and South Ribble CCG* |
| Bolton | 203.94 | 62.50 | 2.86 | 108.20 | 17.20 | 426.82 | 29 | +10 | NHS Bolton CCG |
| Southwark | 346.09 | 62.70 | 2.76 | 91.00 | 8.30 | 431.58 | 30 | +3 | NHS Southwark CCG |
| Newcastle upon Tyne | 245.84 | 59.20 | 2.92 | 97.80 | 14.40 | 432.54 | 31 | -1 | NHS Newcastle Gateshead CCG |
| Stoke-on-Trent | 118.44 | 57.40 | 2.84 | 102.60 | 17.00 | 434.96 | 32 | +3 | NHS Stoke on Trent CCG |
| Newham | 249.43 | 58.40 | 2.86 | 95.40 | 7.50 | 436.36 | 33 | -6 | NHS Newham CCG |
| Kingston upon Hull, City of | 99.37 | 57.20 | 2.81 | 118.30 | 15.00 | 438.72 | 34 | +11 | NHS Hull CCG |
| Salford | 187.49 | 58.00 | 2.91 | 110.40 | 14.30 | 439.78 | 35 | -6 | NHS Salford CCG |
| Lewisham | 272.13 | 60.60 | 2.86 | 99.80 | 9.40 | 440.02 | 36 | -8 | NHS Lewisham CCG |
| Sefton | 242.20 | 64.00 | 2.92 | 90.90 | 23.30 | 445.28 | 37 | +1 | NHS South Sefton CCG |
| Cumbria | 306.48 | 63.48 | 2.97 | 83.61 | 24.10 | 445.88 | 38 | -2 | NHS Morecambe Bay CCG |
| Stockton-on-Tees | 122.20 | 57.50 | 2.83 | 91.40 | 18.10 | 446.22 | 39 | -8 | NHS Hartlepool and Stockton-on-Tees CCG |
| Bury | 183.05 | 60.40 | 2.89 | 96.80 | 18.20 | 451.90 | 40 | +1 | NHS Bury CCG |
| Hartlepool | 101.89 | 58.10 | 2.89 | 106.10 | 19.30 | 454.98 | 41 | -4 | NHS Hartlepool and Stockton-on-Tees CCG |
| Barking and Dagenham | 192.45 | 60.10 | 2.82 | 104.60 | 9.30 | 455.46 | 42 | -8 | NHS Barking and Dagenham CCG |
| Nottingham | 118.10 | 57.70 | 2.81 | 121.70 | 11.50 | 457.30 | 43 | -11 | NHS Nottingham City CCG |
| Blackburn with Darwen | 162.48 | 58.80 | 2.89 | 110.70 | 14.50 | 466.50 | 44 | +9 | NHS Blackburn with Darwen CCG |
| County Durham | 183.31 | 59.30 | 2.96 | 88.20 | 20.60 | 466.62 | 45 | +13 | NHS Durham Dales, Easington and Sedgefield CCG |
| Kirklees | 101.20 | 60.50 | 2.72 | 98.60 | 17.50 | 470.60 | 46 | -3 | NHS Greater Huddersfield CCG |
| Bradford | 112.07 | 60.10 | 2.78 | 106.10 | 14.80 | 470.98 | 47 | +3 | NHS Airedale, Wharfedale and Craven CCG |
| Ealing | 272.53 | 63.80 | 2.71 | 85.80 | 12.80 | 476.28 | 48 | -1 | NHS Ealing CCG |
| Havering | 220.71 | 64.20 | 2.82 | 88.80 | 18.00 | 479.90 | 49 | -3 | NHS Havering CCG |
| Warrington | 219.52 | 64.70 | 2.79 | 82.40 | 18.60 | 485.58 | 50 | +7 | NHS Warrington CCG |