Leaving no place behind in the race to net zero
A new index measuring the economic vulnerability of places as Great Britain transitions to net zero
8 November 2021
17 minute read
About this article
As part of CPP’s work on the UK’s push for net zero, this article explores the relative economic vulnerability of different places as high emitting industries shift production methods and some decline. It develops a series of indicators for assessing the local authorities at highest risk of increased unemployment, lower wages and reduced economic activity. The central premise is that vulnerability will not just be driven by the immediate industrial make-up of an area, but also other critical economic and demographic characteristics. It is an important starting point for ensuring a fair transition and avoiding the mistakes of deindustrialisation in the past.
This new research comes as local leaders who form CPP’s Inclusive Growth Network (IGN), including Mayor of the West Midlands Andy Street and Mayor of Greater Manchester Andy Burnham, set out a plan to ensure that their communities are able to make a ‘just transition’ to the net zero world, in ways which bolster rather than damage local economies.
Introduction: a new green world of work?
Tackling climate change is as much an economic responsibility, as it is an environmental one. The effects of unsustainable growth are already being witnessed, contributing to the rapid erosion of natural resources and millions of premature deaths.[1] Without action to curb the emission of greenhouse gases (GHG), the environment will be irreparably damaged, resulting in extensive economic damage to production and livelihoods.
To cement a course of action, the UK government has committed to an ambition of net-zero carbon emissions by 2050. By 2019, emissions had fallen to 45% below those seen in 1990.[2] Efforts to reduce reliance on coal and developing “more efficient industrial processes” help to explain this decline, alongside a substantial shift away from traditional, carbon-intensive manufacturing.[3] However, there is still a long way to go for the UK to transform into an environmentally sustainable economy.
While the case for net zero is clear and irrefutable, shifting economic activity away from high emissions industries will have significant impacts on large parts of the workforce. CPP estimates that 2.4 million people work in industries characterised by high intensity GHG emissions.[4] Many of these people also happen to be well paid - we estimate the average weekly earnings for high emitting jobs is £680 per week by comparison to £580 for the rest of the economy.[5] People will not want to change jobs if they are paid less, but many high emitting jobs will have to change, some are already changing, others may go forever. Ensuring that people can transition to a new or altered role in their existing industry or can find a well-paid, secure job elsewhere is a key challenge for the net zero agenda. The answer will not always be green jobs but instead other types of good work already in our economy.
So far, public policy announcements have mainly focussed on bold targets for reducing emissions and creating new ‘green’ jobs. But there is scant detail about what government thinks is a new green job or how they going to create the 440,000 new green jobs by 2030, as is anticipated in the Net Zero Strategy.[6] Neither do we know the extent to which these new jobs will be situated in poorer communities supporting workers who are leaving dying industries, or situated in already affluent areas. For many people, transitioning to the next biggest employer or industry in the local area will be the reality – whether its ‘green’ or not.
In order to maintain the political will to address climate change, it will be crucial that the transition to net zero does not leave workers and their communities behind. To this end, this article is devoted to understanding which places require particular attention because they are both highly reliant on jobs in high emitting sectors and because the wider local economy is already vulnerable – less able to absorb job losses and provide new economic opportunities. A subsequent CPP paper will explore the policy measures required to support such communities.
Understanding economic disruption at the local level
Different places will have different challenges as they try to reduce their GHG emissions. For some places, transport emissions will be the dominant form of pollution, for others it will be commercial property or domestic emissions. All of these represent substantial challenges, but they are not the focus of this article, instead we identify those local economies that are most likely to be negatively disrupted through changes to work. These are the places that, in the absence of a robust and coordinated policy response, face the greatest risk of increased unemployment and lower pay due to the transition.
What does disruption mean?
By disruption, this article means big changes to an area’s economic way of life caused by the push for net zero. At its worst, it could mean a large proportion of the workforce being made redundant as their key industry declines because of its high reliance on outdated carbon intensive processes and a weak local economy. The decline of coal mines in the 1980s is a good example of the kind of economic dislocation that must be avoided - with mass unemployment and poverty the result for many communities. But disruption does not have to be so painful. Some areas will see their industries adapt to new economic and political realities such as car manufacturers, many of whom are already shifting from petrol to electric vehicles. In these cases, many workers will be retrained and continue to work in the same industry but with new skills. And even if people do lose their jobs, they may still be able to move into alternative sectors in the local economy thereby sustaining their employment and earnings. It is about both job availability and skills matching.
Place based characteristics matter
The economic and demographic characteristics of an area will determine which of the above paths it takes. Some people and places will be better able to cope with disruption than others:
- Individuals with relatively high skill levels will be better able to either transition to a new job within the same industry or alternatively find work outside of it if they are made redundant. Those with only low-level skills may struggle more to find new work.[7]
- Demographics also matter. Once unemployed, older workers have a tougher time accessing (re)training and employment opportunities with those over 50 and unemployed more than twice as likely to stay jobless for over a year than those aged 18-24.[8]
- The ability of a place to absorb job losses will also depend on the structure of the local economy. If the economy is very reliant on one or two industries which are in decline, then it will struggle to offer the newly unemployed alternative work. It will also face a substantial hit to economic output from the loss of a key industry with reduced demand in the local economy impacting on the livelihoods of many of those who live and work in the area.
- Even if those who become unemployed successfully find a job in another industry, if the local area is characterised by low paid precarious work, then those individuals will still lose out. Transitioning from a decent job with good pay and stability to a bad paid job with insecurity of hours would represent a very poor transition for workers.
The net zero risk register
The think tanks Onward and the Social Market Foundation (SMF) have both made important contributions to the net zero debate from a place-based perspective.[9] The former explored the prevalence of high emitting jobs for former Red Wall areas to place the net zero challenge within a levelling up context, while the latter created a disruption index based partly on high emitting jobs and partly on a few key local economic variables. SMF also developed an opportunity index to try and work out which local authorities were best placed to take advantage of the transition.[10]
This article goes further in exploring the underlying vulnerability of different places to a bad transition. It includes a broader array of economic and demographic indicators and adopts a pragmatic way of aggregating all the information into a risk register. The ultimate objective being to identify the places at highest risk of substantial rises in unemployment and/or reduced wages in the absence of policies to support a fair transition. These places will require particularly stringent monitoring and mitigating actions on the part of local and national government.
The indicators
Reliance of local labour markets on high emitting sector:
We start by exploring the structure of the local labour market, the industries that people work in, and the emissions intensity of the work being done.
- Emissions weighted employment index: This is calculated by multiplying the share of each industry’s employment within a local area by the GHG emissions intensity of that industry at the national level. To be clear, this is not about the overall level of pollution emitted by an area but the concentration of GHG emissions from the jobs that people do.[11]
Economic vulnerability:
As discussed above, vulnerability to the net zero transition is about more than the emissions intensity of current jobs – it is also determined but an area’s broader economic, social and demographic characteristics. For this we use several key variables including:
- Skills: Proportion qualified to level 2+ and level 4+. This is to capture both high level and intermediate skills of an area.[12]
- Age of population. Median age of the population. This is to capture the extent to which the workforce is likely to be older and therefore find it harder to retrain and find employment.[13]
- Economic diversity. This is calculated using the Shannon Diversity Index based on economic output (GVA).[14] It captures the extent to which there is an even spread of economic output across industries within an area.
- Economic output: Gross value added per head. Some places may not be diverse but may have a highly productive specialised economy. In this case, lack of diversity will work for them through agglomeration in high value-added industries making them less vulnerable.[15]
- Employment: Employment rate. A good indication of whether there are local job opportunities and a well-functioning labour market.[16]
- Earnings: Median earnings. This is to capture the likelihood of finding good paying alternative local employment in the event of redundancy.[17]
- Population: Total population size. Areas with larger populations are more likely to offer economic diversity and opportunity as well as having local institutions, facilities and amenities that can support resilience.[18]
Bringing it all together
To normalise the data, each of the local authority districts is ranked against each indicator, ranking 1 if it is has the highest level of risk and 354 if it has the lowest. For example, Boston is ranked 1 for median earnings because it has the lowest earnings of any local authority whereas Kensington and Chelsea ranks 354 because it has the highest.
Since there is no clear way to weight each of the indicators, the analysis focuses in on those areas that are both reliant on high emitting industries and have high underlying economic vulnerability. To do this, we first separated local authorities into quintiles based on their total economic vulnerability score (the sum of the ranks for each of the economic vulnerability measures above). Of the 100 areas that have the highest reliance on high emitting industries for employment, 74 are deemed economically vulnerable because their total vulnerability score is worse than the median. In terms of total population size – the 74 areas cover about 9 million people. But 37 areas are extremely economically vulnerable – they score in the bottom 20% of all local authorities in terms of their total vulnerability score.
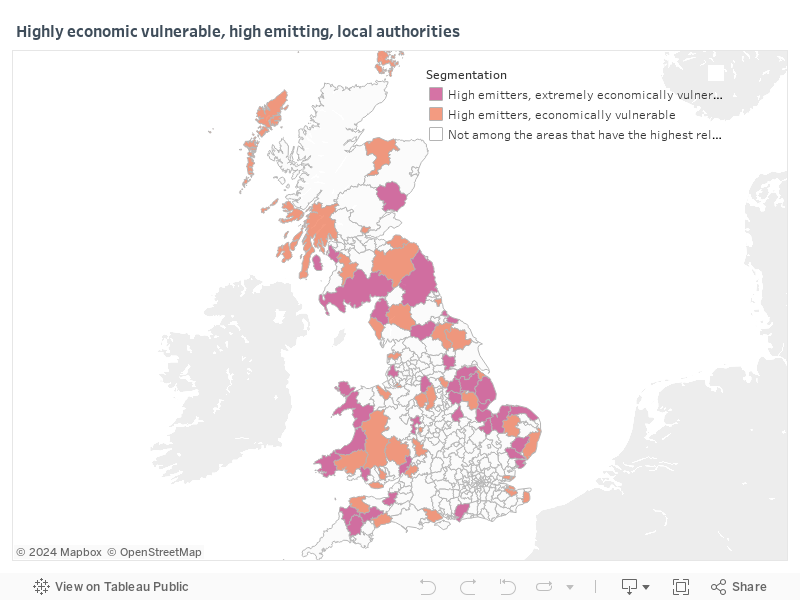
The highest risk 37
The 37 highest risk local areas – covering a total population size of 4.2 million people - score badly on most if not all of the economic vulnerability measures. There are two broad types of places that can be considered high risk:
- Rural agricultural communities with older populations and relatively low intermediate level qualifications such as West Devon and Mid Devon, North Norfolk, Kings Lynn and West Norfolk
- Heavy manufacturing communities in Wales such as Neath Port Talbot as well as those in the North East such as Hartlepool and Northumberland.
The vast majority of these local authorities have low median earnings suggesting that even if workers were able to transition out of high emitting industries, they risk falling into low paid work.
At risk local authorities |
At risk constituencies |
Region |
Bassetlaw |
Bassetlaw |
East Midlands |
Boston |
Boston and Skegness |
East Midlands |
East Lindsey |
Louth and Horncastle |
East Midlands |
High Peak |
High Peak |
East Midlands |
Melton |
Rutland and Melton |
East Midlands |
Newark and Sherwood |
Sherwood |
East Midlands |
Newark |
East Midlands |
|
South Holland |
South Holland and The Deepings |
East Midlands |
West Lindsey |
Gainsborough |
East Midlands |
Babergh |
South Suffolk |
East of England |
Fenland |
North East Cambridgeshire |
East of England |
King's Lynn and West Norfolk |
North West Norfolk |
East of England |
Mid Suffolk |
Bury St Edmunds |
East of England |
Central Suffolk and North Ipswich |
East of England |
|
North Norfolk |
North Norfolk |
East of England |
Tendring |
Clacton |
East of England |
Hartlepool |
Hartlepool |
North East |
Northumberland |
Hexham |
North East |
Berwick-upon-Tweed |
North East |
|
Wansbeck |
North East |
|
Blyth Valley |
North East |
|
Redcar and Cleveland |
Redcar |
North East |
Allerdale |
Workington |
North West |
West Lancashire |
West Lancashire |
North West |
Angus |
Angus |
Scotland |
Dumfries and Galloway |
Dumfriesshire, Clydesdale and Tweeddale |
Scotland |
Dumfries and Galloway |
Scotland |
|
North Ayrshire |
North Ayrshire and Arran |
Scotland |
Chichester |
Chichester |
South East |
Forest of Dean |
Forest of Dean |
South West |
Mid Devon |
Tiverton and Honiton |
South West |
Sedgemoor |
Bridgwater and West Somerset |
South West |
Torridge |
Torridge and West Devon |
South West |
West Devon |
Torridge and West Devon |
South West |
Ceredigion |
Ceredigion |
Wales |
Gwynedd |
Dwyfor Meirionnydd |
Wales |
Arfon |
Wales |
|
Isle of Anglesey |
Ynys Môn |
Wales |
Neath Port Talbot |
Aberavon |
Wales |
Neath |
Wales |
|
Pembrokeshire |
Preseli Pembrokeshire |
Wales |
Carmarthen West and South Pembrokeshire |
Wales |
|
South Staffordshire |
South Staffordshire |
West Midlands |
North Lincolnshire |
Brigg and Goole |
Yorkshire and The Humber |
Scunthorpe |
Yorkshire and The Humber |
|
Selby |
Selby and Ainsty |
Yorkshire and The Humber |
Richmondshire |
Richmond (Yorks) |
Yorkshire and The Humber |
What does the risk rating tell us about the vulnerability of different places to net zero?
The ranking is based on the premise that a bad transition will be determined by a broad array of economic and demographic characteristics and not just the how concentrated employment is in high emitting sectors. This has important policy implications. At a national level, it should help to guide decisions about where to incentivise and locate any new green jobs as well as taking special effort to secure the survival and greening of critical industries for those local economies. It should also help policymakers at all levels shift away from a focus primarily on new green jobs - important though they are – and onto a broader set of policy objectives to improve the resilience of local areas. Many people may leave high emitting sectors into jobs that are neither considered polluting nor green.
In practical terms this will mean working with employers who are about to make employees redundant in vulnerable areas and helping to support workers into new roles. It also includes, seeking improvements to the quality of work in less energy intense sectors which may ultimately become the destinations for those who lose their jobs during the transition.
Ultimately, the above risk rating is intended to kick-start discussion and action on taking a broader approach to economic policy as we push for net zero. In light of the analysis and framework set out above, over the coming months we will be developing a series of policy recommendations at national and local level to address some of the challenges and implications raised here.
Notes
[1] Stern N (2018) The economic reasons to act on climate change, and to act immediately. The Grantham Research Institute. Available at: https://www.lse.ac.uk/granthaminstitute/wp-content/uploads/2018/07/Stern_Economic-reasons-to-act-on-climate-change-and-to-act-now.pdf
[2] Department for Business Innovation and Skills (2020) Provisional UK greenhouse gas emissions national statistics 2019. Available at: https://www.gov.uk/government/statistics/provisional-uk-greenhouse-gas-emissions-national-statistics-2019
[3] Evans S (2021) UK is now halfway to meeting its ‘net-zero emissions’ target, Carbon Brief: Available at: https://www.carbonbrief.org/analysis-uk-is-now-halfway-to-meeting-its-net-zero-emissions-target
[4] High GHG emissions intensity is defined as an industry that has higher GHG intensity than the total for all industrial sectors. Greenhouse gas emissions intensity is calculated by dividing the level of greenhouse gas emissions by Gross Value Added (GVA).
[5] CPP estimates based on Annual Survey of Hours and Earnings.
[6] Department for Business, Energy and Industrial Strategy (2021), Net Zero Strategy: Build Back Greener. Available at: https://www.gov.uk/government/publications/net-zero-strategy
[7] If the share of the local working age population without any formal qualifications were reduced in every area to the rate seen in the top 10% of local authorities, employment in England would be up to 573,000 higher. Norman (2021), Report for CPP, Skill up to level up. Available at: https://www.progressive-policy.net/publications/skill-up-to-level-up
[8] Centre for Ageing Better (2020). A mid-life employment crisis: how COVID-19 will affect the job prospects of older workers. Available at: https://ageing-better.org.uk/news/covid-19-risks-triggering-long-term-unemployment-crisis-older-workers
[9] Christie-Miller (2021) Getting to zero: A practical policy commission to deliver decarbonisation in the UK. Report for Onward. Available at: https://www.ukonward.com/wp-content/uploads/2021/09/getting-to-zero-onward.pdf
[10] Corfe and Norman (2021) Zeroing in: Net disruption and opportunity at a local level. Report for SMF. Available at: https://www.smf.co.uk/wp-content/uploads/2021/09/Zeroing-in-Sept2021.pdf
[11] Local job shares by 2, 3 and 4 digit codes are taken from ONS Business Register and Employment
Survey for 2019 accessed via Nomis. Data on job shares is only available for Great Britain. This is then combined with GHG emissions intensity data from ONS Atmospheric emissions: greenhouse gas emissions intensity by industry.
[12] This is from the Annual Population Survey accessed via Nomis.
[13] ONS midyear population estimates. Median age of population for local authorities in the UK, mid-2001 to mid-2020
[14] Calculated on local authority industry GVA. ONS (2021) Regional gross value added (balanced) by industry: local authorities by ITL1 region. The Shannon Diversity Index formula is: -∑[(pi) × ln(pi)]. Pi = proportion of each industry of total local authority GVA.
[15] CPP calculations based on ONS (2021) Regional gross value added (balanced) by industry: local authorities by ITL1 region and ONS mid-year population estimates.
[16] Annual Population Survey accessed via Nomis.
[17] Annual Survey of Hours and Earnings (2021). Median earnings based on gross weekly pay.
[18] ONS midyear population estimates. Population density for local authorities in the UK, mid-2001 to mid-2020.